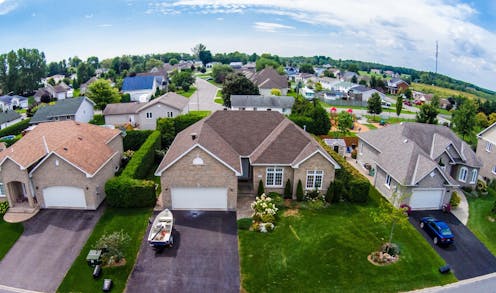
How to put data to work in your neighborhood
Many cities lack the resources to analyze their own vast troves of administrative data.

Every day, city governments collect vast amounts of administrative data – local property tax assessments, 911 emergency response calls, social assistance recipients and more.
These data have huge potential to enhance residents’ quality of life and stimulate economic growth. Many local governments have jumped to create so-called “smart cities” that harness these data to enhance livability, workability and sustainability.
But most cities still don’t use their own administrative data to inform their decisions. In many cases, they lack the technical capacity and have only limited resources.
Our lab has worked with the city of Arlington, Virginia to strengthen their services, particularly through the demographic planning and fire and police departments. Our work, which we are now expanding across Virginia and Iowa, shows how cities across America can leverage the data they already have to improve residents’ lives.
Start with existing data
By overlooking their administrate data, local governments are missing out on innovative ways to address their most pressing problems. Data provide a valuable way to describe the nature of the problems, assess the likely impact of potential solutions and predict future outcomes.
For example, in 2015, Arlington demographers wanted to understand the demographic and economic diversity of housing in local neighborhoods. Knowing this could help them better plan school enrollments and adjust future school boundaries.
Housing value information from local property data is an excellent proxy for diversity, as it represents the wealth of the household. Individual local property values provide more timely and detailed information than federal data sets.
We used these data to determine measures of diversity, down to the census block level or even smaller. We calculated diversity by computing the probability that two housing values selected at random from the geographic area differ on home value. The higher the score, the more diverse the home values are in the region.
This information provided city demographers with a new lens to explore available housing opportunities and relate this information back to younger families with children, whose income is often lower than other families. Higher economic diversity is an indicator of more opportunities for all. It also helped them plan for school age enrollments by age.
Using all data
Government decisions have even more impact when local officials can combine their own data with other easily accessible outside resources, such as social media and state or federal databases. These combined sources can provide a more holistic view of our neighborhoods.
The Arlington fire chief, for example, wanted to improve situational awareness of his fire department operations by using his data on the current placement of equipment and personnel.
We looked at what time incidents were reported and responded to. The patterns for response time in relation to distance from the call appeared similar across stations. However, by plugging the data into a statistical model and controlling for several other variables – including month, hour of day and call type – we found that response times were highest for calls for hazardous materials investigations, highway calls and wires-down incidents.
These estimates helped the fire chief better anticipate when these incidents might occur and decide where to place fire or medic units and when to have more firefighters available.
Scaling our work
Today, there are many examples of cities using administrative data to advance the public good. In San Francisco, the Department of Public Health partners with the private sector to inform the public about potential health issues seen in public health data and local data – for example, by adding city restaurant inspection ratings to Yelp restaurant ratings. In Alburquerque, New Mexico, universities and local governments are working together to better understand the size, composition and behavior of those who have been arrested multiple times.
Scaling and sustaining such an approach requires a new and bold agenda. The universities we work at are land grant institutions, meaning that they’re part of a class of universities founded to provide the working class with a practical education directly relevant to their daily lives. One of our primary roles is to translate evidence-based research for the public.
We believe that land grant universities like ours should build upon their current roles and bring data in service of the public good. By partnering more closely with local governments, researchers can help communities that are data-driven to govern more intelligently.
Stephanie Shipp received funding from Laura and John Arnold Foundation and the U. S. Census Bureau.
Catherine Woteki is affiliated with Global Open Data for Agriculture and Nutrition.
Sallie Keller received funding from the Laura and John Arnold Foundation and the U. S. Census Bureau.
Sarah M. Nusser does not work for, consult, own shares in or receive funding from any company or organization that would benefit from this article, and has disclosed no relevant affiliations beyond their academic appointment.
Read These Next
US exit from the World Health Organization marks a new era in global health policy – here’s what the
The US will no longer participate in the WHO’s global influenza monitoring system – a shift experts…
Short on resources, special educators are using AI – with little knowledge of the effects
As AI spreads in special education, the question remains: Can these tools uphold the individualized,…
Grammys’ AI rules aim to keep music human, but large gray area leaves questions about authenticity a
AI is already in much of the music you hear. It can be as mundane as a production tool or as deceptive…


