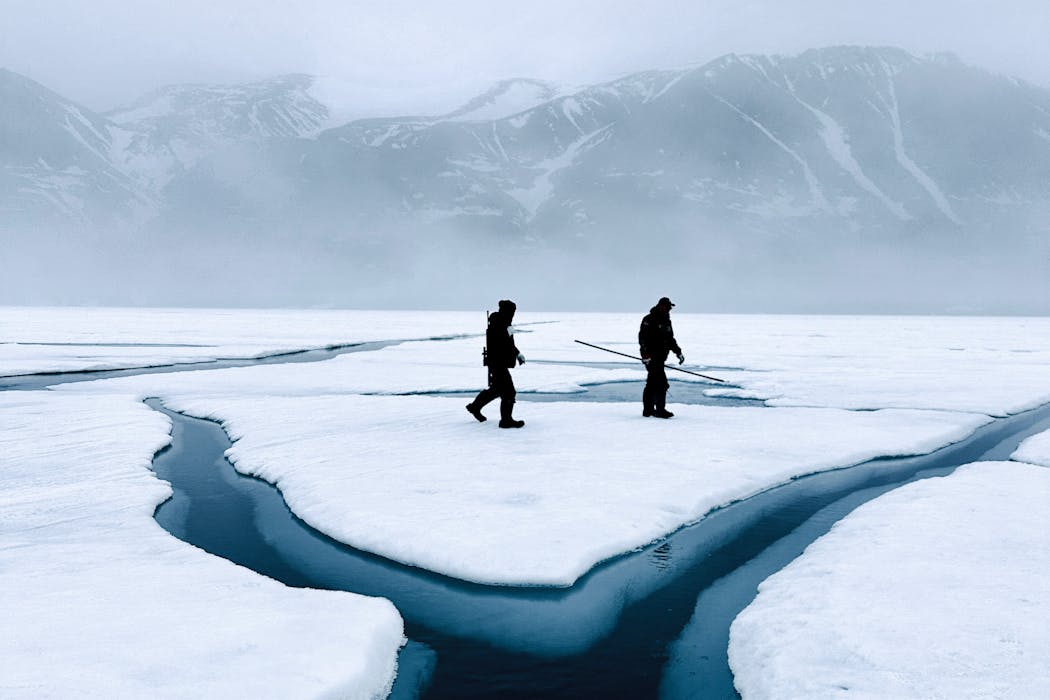
From record warming to rusting rivers, 2025 Arctic Report Card shows a region transforming faster th
The 20th anniversary of the annual report tracks how sea ice, snow cover and many other vital signs of the Arctic have changed, and the impact that’s having on people and wildlife.

The Arctic is transforming faster and with more far-reaching consequences than scientists expected just 20 years ago, when the first Arctic Report Card assessed the state of Earth’s far northern environment.
The snow season is dramatically shorter today, sea ice is thinning and melting earlier, and wildfire seasons are getting worse. Increasing ocean heat is reshaping ecosystems as non-Arctic marine species move northward. Thawing permafrost is releasing iron and other minerals into rivers, which degrades drinking water. And extreme storms fueled by warming seas are putting communities at risk.
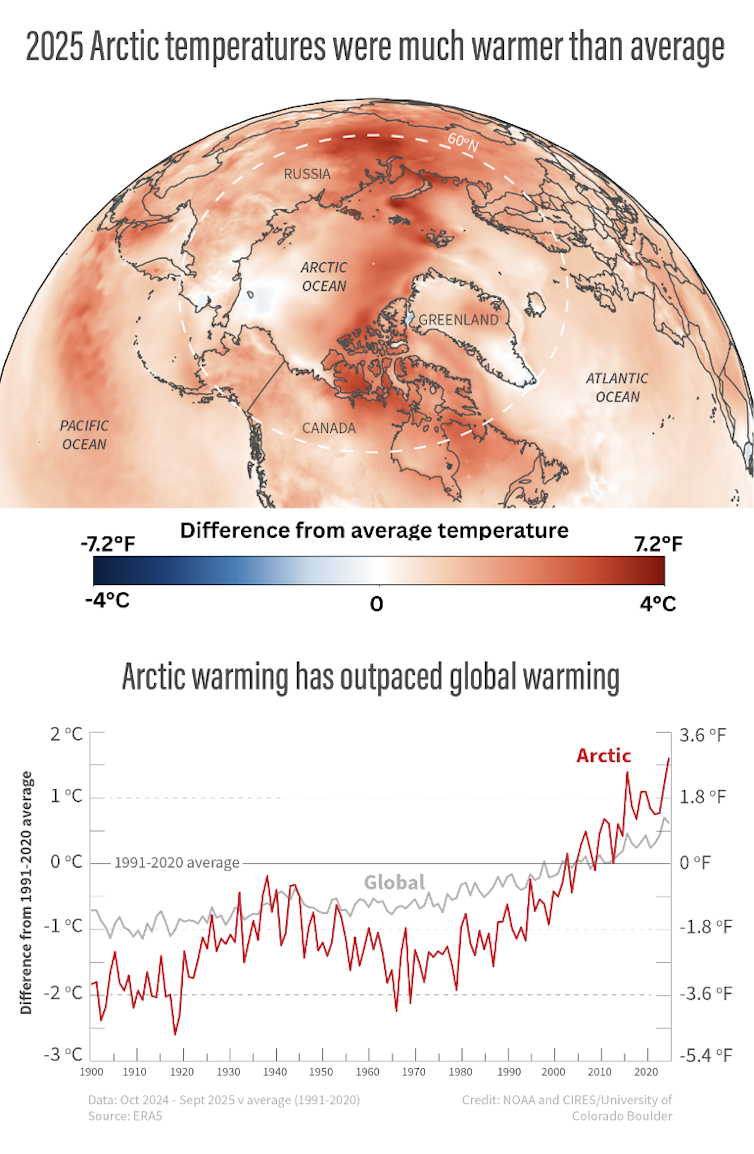
The past water year, October 2024 through September 2025, brought the highest Arctic air temperatures since records began 125 years ago, including the warmest autumn ever measured and a winter and a summer that were among the warmest on record. Overall, the Arctic is warming more than twice as fast as the Earth as a whole.
For the 20th Arctic Report Card, we worked with the National Oceanic and Atmospheric Administration, an international team of scientists and Indigenous partners from across the Arctic to track environmental changes in the North – from air and ocean temperatures to sea ice, snow, glaciers and ecosystems – and the impacts on communities.
Together, these vital signs reveal a striking and interconnected transformation underway that’s amplifying risks for people who live there.
A wetter Arctic with more extreme precipitation
Arctic warming is intensifying the region’s water cycle.
A warmer atmosphere increases evaporation, precipitation and meltwater from snow and ice, adding and moving more water through the climate system. That leads to more extreme rainstorms and snowstorms, changing river flows and altering ecosystems.
The Arctic region saw record-high precipitation for the entire 2025 water year and for spring, with the other seasons each among the top-five wettest since at least 1950. Extreme weather – particularly atmospheric rivers, which are long narrow “rivers in the sky” that transport large amounts of water vapor – played an outsized role.
These wetter conditions are reshaping snow cover across the region.
Snow and ice losses accelerate warming, hazards
Snow blankets the Arctic throughout much of the year, but that snow cover isn’t lasting as long. In 2025, snowpack was above average in the cold winter months, yet rapid spring melting left the area covered by snow far smaller than normal by June, continuing a six-decade decline. June snow cover in recent years has been half of what it was in the 1960s.
Losing late spring snow cover means losing a bright, reflective surface that helps keep the Arctic cool, allowing the land instead to be directly warmed by the sun, which raises the temperature.
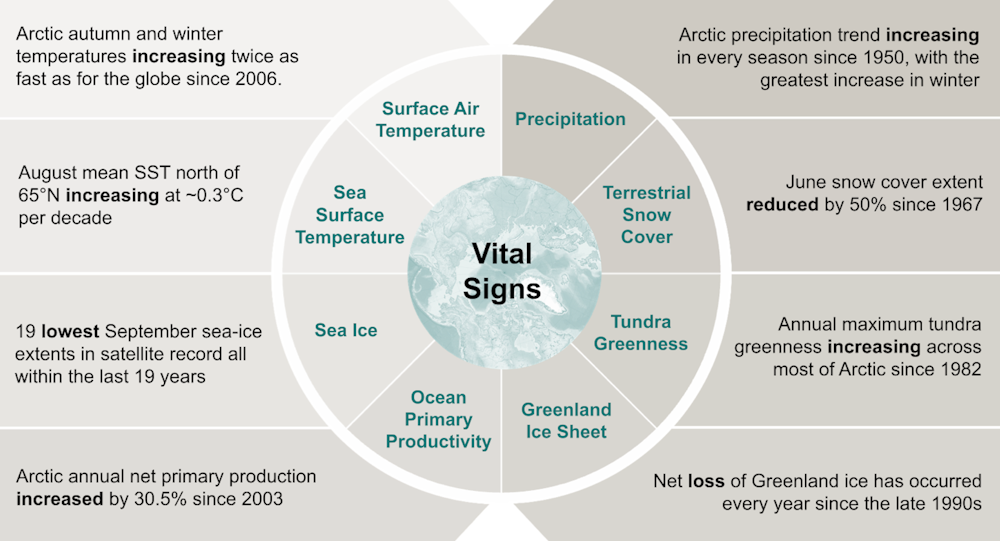
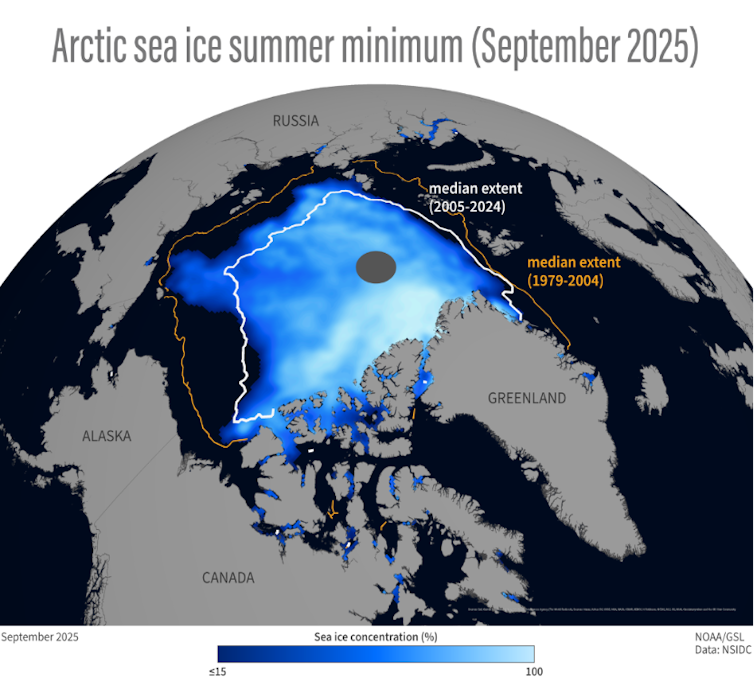
Sea ice tells a similar story. The year’s maximum sea ice coverage, reached in March, was the lowest in the 47-year satellite record. The minimum sea ice coverage, in September, was the 10th lowest.
Since the 1980s, the summer sea ice extent has shrunk by about 50%, while the area covered by the oldest, thickest sea ice – ice that has existed for longer than four years – has declined by more than 95%.
The thinner sea ice cover is more influenced by winds and currents, and less resilient against warming waters. This means greater variability in sea ice conditions, causing new risks for people living and working in the Arctic.
The Greenland Ice Sheet continued to lose mass in 2025, as it has every year since the late 1990s. As the ice sheet melts and calves more icebergs into the surrounding seas, it adds to global sea-level rise.
Mountain glaciers are also losing ice at an extraordinary rate – the annual rate of glacier ice loss across the Arctic has tripled since the 1990s.
This poses immediate local hazards. Glacial lake outburst floods – when water that is dammed up by a glacier is suddenly released – are becoming more frequent. In Juneau, Alaska, recent outburst floods from Mendenhall Glacier have inundated homes and displaced residents with record-setting levels of floodwater.

Glacier retreat can also contribute to catastrophic landslide impacts. Following the retreat of South Sawyer Glacier, a landslide in southeast Alaska’s Tracy Arm in August 2025 generated a tsunami that swept across the narrow fjord and ran nearly 1,600 feet (nearly 490 meters) up the other side. Fortunately, the fjord was empty of the cruise ships that regularly visit.
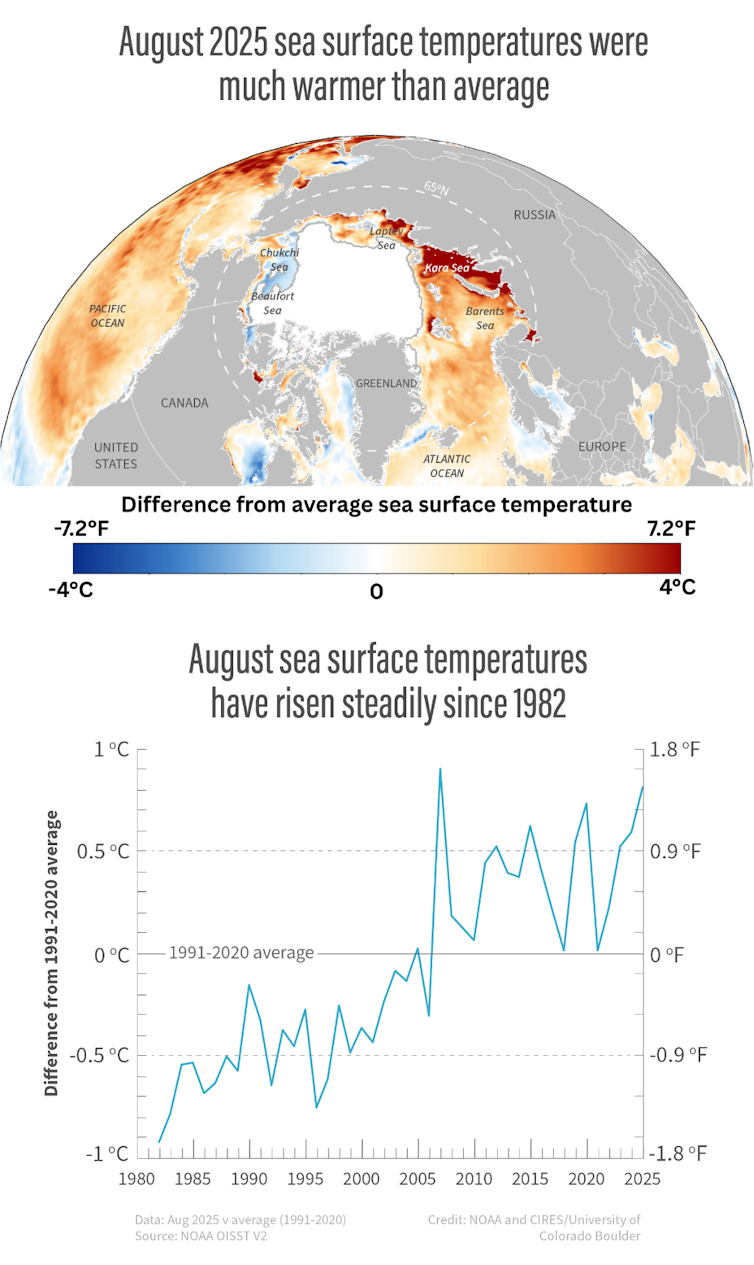
Record-warm oceans drive storms, ecosystem shifts
Arctic Ocean surface waters are steadily warming, with August 2025 temperatures among the highest ever measured. In some Atlantic-sector regions, sea surface temperatures were as much as 13 degrees Fahrenheit (7.2 Celsius) above the 1991-2020 average. Some parts of the Chukchi and Beaufort seas were cooler than normal.
Warm water in the Bering Sea set the stage for one of the year’s most devastating events: Ex-Typhoon Halong, which fed on unusually warm ocean temperatures before slamming into western Alaska with hurricane-force winds and catastrophic flooding. Some villages, including Kipnuk and Kwigillingok, were heavily damaged.
As seas warm, powerful Pacific cyclones, which draw energy from warm water, are reaching higher latitudes and maintaining strength longer. Alaska’s Arctic has seen four ex-typhoons since 1970, and three of them arrived in the past four years.

The Arctic is also seeing warmer, saltier Atlantic Ocean water intrude northward into the Arctic Ocean. This process, known as Atlantification, weakens the natural layering of water that once shielded sea ice from deeper ocean heat. It is already increasing sea ice loss and reshaping habitat for marine life, such as by changing the timing of phytoplankton production, which provides the base of the ocean food web, and increasing the likelihood of harmful algal blooms.
From ocean ‘borealization’ to tundra greening
Warming seas and declining sea ice are enabling southern, or boreal, marine species to move northward. In the northern Bering and Chukchi seas, Arctic species have declined sharply – by two-thirds and one-half, respectively – while the populations of boreal species expand.
On land, a similar “borealization” is underway. Satellite data shows that tundra vegetation productivity – known as tundra greenness – hit its third-highest level in the 26-year record in 2025, part of a trend driven by longer growing seasons and warmer temperatures. Yet greening is not universal – browning events caused by wildfires and extreme weather are also increasing.

Summer 2025 marked the fourth consecutive year with above-median wildfire area across northern North America. Nearly 1,600 square miles (over 4,000 square kilometers) burned in Alaska and over 5,000 square miles (over 13,600 square kilometers) burned in Canada’s Northwest Territories.
Permafrost thaw is turning rivers orange
As permafrost – the frozen ground that underlies much of the Arctic – continues its long-term warming and thaw, one emerging consequence is the spread of rusting rivers.
As thawing soils release iron and other minerals, more than 200 watersheds across Arctic Alaska now show orange discoloration. These waters exhibit higher acidity and elevated levels of toxic metals, which can contaminate fish habitat and drinking water and impact subsistence livelihoods.
In Kobuk Valley National Park in Alaska, a tributary to the Akillik River lost all its juvenile Dolly Varden and slimy sculpin fish after an abrupt increase in stream acidity when the stream turned orange.

Arctic communities lead new monitoring efforts
The rapid pace of change underscores the need for strong Arctic monitoring systems. Yet many government-funded observing networks face funding shortfalls and other vulnerabilities.
At the same time, Indigenous communities are leading new efforts.
The Arctic Report Card details how the people of St. Paul Island, in the Bering Sea, have spent over 20 years building and operating their own observation system, drawing on research partnerships with outside scientists while retaining control over monitoring, data and sharing of results. The Indigenous Sentinels Network tracks environmental conditions ranging from mercury in traditional foods to coastal erosion and fish habitat and is building local climate resilience in one of the most rapidly changing environments on the planet.

The Arctic is facing threats from more than the changing climate; it’s also a region where concerns of ecosystem health and pollutants come sharply into view. In this sense, the Arctic provides a vantage point for addressing the triple planetary crisis of climate change, biodiversity loss and pollution.
The next 20 years will continue to reshape the Arctic, with changes felt by communities and economies across the planet.
Matthew L. Druckenmiller receives funding from the National Oceanic and Atmospheric Administration (NOAA) to serve as an editor for the Arctic Report Card.
Rick Thoman receives funding from the National Oceanic and Atmospheric Administration (NOAA) to serve as an editor for the Arctic Report Card.
Twila A. Moon receives funding from the National Oceanic and Atmospheric Administration (NOAA) to serve as an editor for the Arctic Report Card.
Read These Next

Republicans control Congress, so why is Trump’s SAVE America Act stuck?
Republicans hold both chambers and publicly back the president’s signature bill that would curtail…

Why you let down your guard on ads when scrolling on social media
When you’re tired and distracted, an online ad’s claims can be more effective in pitching a product…

Rubio’s international ‘antifa summit’ takes place after Trump’s national security policy has already
Almost a year after President Trump authorized preemptive law enforcement measures based on political…