5 forecasts early climate models got right – the evidence is all around you
From rising global temperatures to the fast-warming Arctic, early climate models predicted the changes half a century ago.
Climate models are complex, just like the world they mirror. They simultaneously simulate the interacting, chaotic flow of Earth’s atmosphere and oceans, and they run on the world’s largest supercomputers.
Critiques of climate science, such as the report written for the Department of Energy by a panel in 2025, often point to this complexity to argue that these models are too uncertain to help us understand present-day warming or tell us anything useful about the future.
But the history of climate science tells a different story.
The earliest climate models made specific forecasts about global warming decades before those forecasts could be proved or disproved. And when the observations came in, the models were right. The forecasts weren’t just predictions of global average warming – they also predicted geographical patterns of warming that we see today.
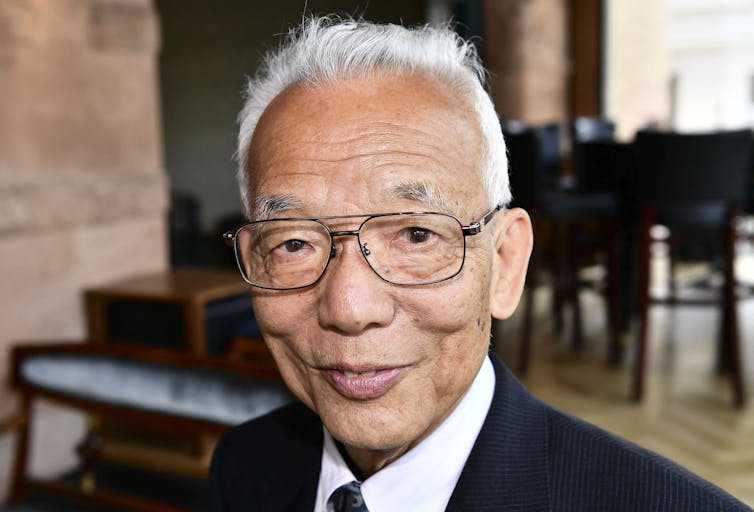
These early predictions starting in the 1960s emanated largely out of a single, somewhat obscure government laboratory outside Princeton, New Jersey: the Geophysical Fluid Dynamics Laboratory. And many of the discoveries bear the fingerprints of one particularly prescient and persistent climate modeler, Syukuro Manabe, who was awarded the 2021 Nobel Prize in physics for his work.
Manabe’s models, based in the physics of the atmosphere and ocean, forecast the world we now see while also drawing a blueprint for today’s climate models and their ability to simulate our large-scale climate. While models have limitations, it is this track record of success that gives us confidence in interpreting the changes we’re seeing now, as well as predicting changes to come.
Forecast No. 1: Global warming from CO2
Manabe’s first assignment in the 1960s at the U.S. Weather Bureau, in a lab that would become the Geophysical Fluid Dynamics Laboratory, was to accurately model the greenhouse effect – to show how greenhouse gases trap radiant heat in Earth’s atmosphere. Since the oceans would freeze over without the greenhouse effect, this was a key first step in building any kind of credible climate model.
To test his calculations, Manabe created a very simple climate model. It represented the global atmosphere as a single column of air and included key components of climate, such as incoming sunlight, convection from thunderstorms, and his greenhouse effect model.
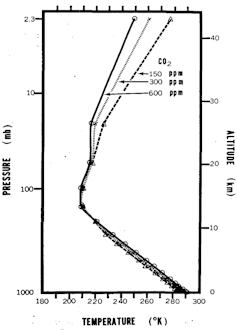
Despite its simplicity, the model reproduced Earth’s overall climate quite well. Moreover, it showed that doubling carbon dioxide concentrations in the atmosphere would cause the planet to warm by about 5.4 degrees Fahrenheit (3 degrees Celsius).
This estimate of Earth’s climate sensitivity, published in 1967, has remained essentially unchanged in the many decades since and captures the overall magnitude of observed global warming. Right now the world is about halfway to doubling atmospheric carbon dioxide, and the global temperature has warmed by about 2.2 F (1.2 C) – right in the ballpark of what Manabe predicted.
Other greenhouses gases such as methane, as well as the ocean’s delayed response to global warming, also affect temperature rise, but the overall conclusion is unchanged: Manabe got Earth’s climate sensitivity about right.
Forecast No. 2: Stratospheric cooling
The surface and lower atmosphere in Manabe’s single-column model warmed as carbon dioxide concentrations rose, but in what was a surprise at the time, the model’s stratosphere actually cooled.
Temperatures in this upper region of the atmosphere, between roughly 7.5 and 31 miles (12 and 50 km) in altitude, are governed by a delicate balance between the absorption of ultraviolet sunlight by ozone and release of radiant heat by carbon dioxide. Increase the carbon dioxide, and the atmosphere traps more radiant heat near the surface but actually releases more radiant heat from the stratosphere, causing it to cool.
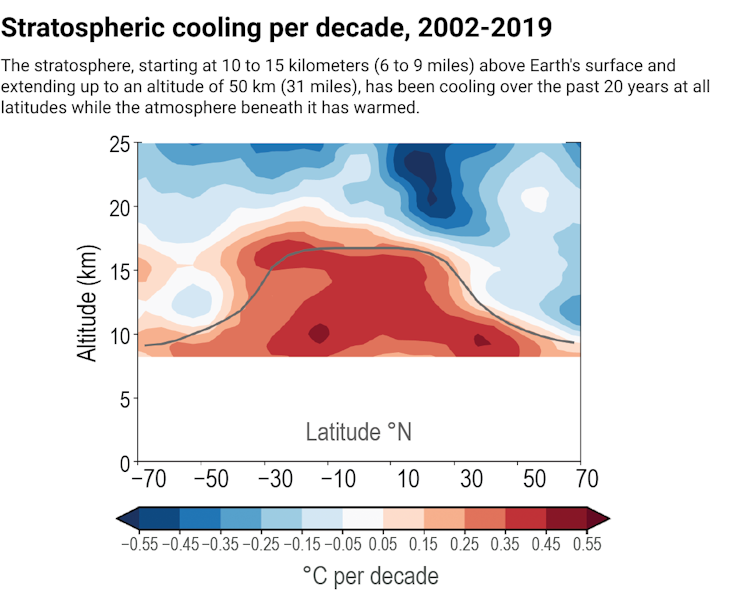
This cooling of the stratosphere has been detected over decades of satellite measurements and is a distinctive fingerprint of carbon dioxide-driven warming, as warming from other causes such as changes in sunlight or El Niño cycles do not yield stratospheric cooling.
Forecast No. 3: Arctic amplification
Manabe used his single-column model as the basis for a prototype quasi-global model, which simulated only a fraction of the globe. It also simulated only the upper 100 meters or so of the ocean and neglected the effects of ocean currents.
In 1975, Manabe published global warming simulations with this quasi-global model and again found stratospheric cooling. But he also made a new discovery – that the Arctic warms significantly more than the rest of the globe, by a factor of two to three times.
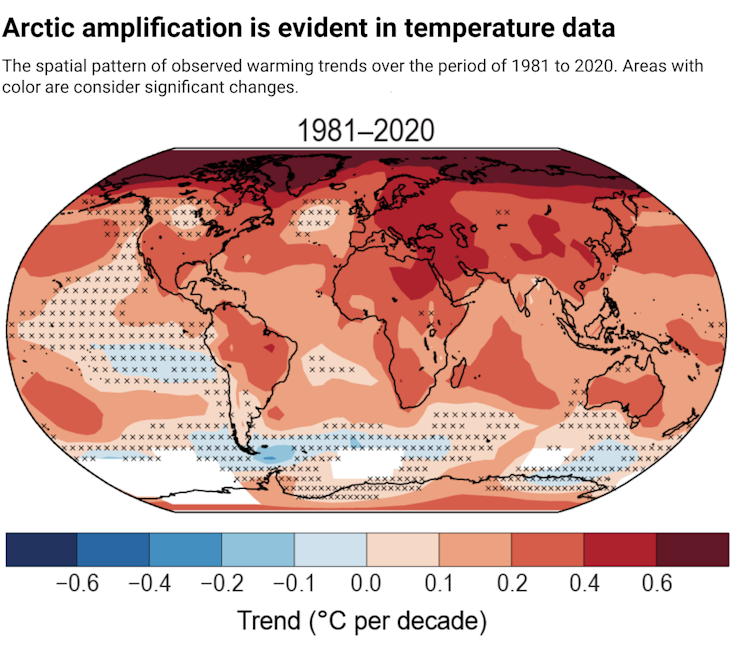
This “Arctic amplification” turns out to be a robust feature of global warming, occurring in present-day observations and subsequent simulations. A warming Arctic furthermore means a decline in Arctic sea ice, which has become one of the most visible and dramatic indicators of a changing climate.
Forecast No. 4: Land-ocean contrast
In the early 1970s, Manabe was also working to couple his atmospheric model to a first-of-its-kind dynamical model of the full world ocean built by oceanographer Kirk Bryan.
Around 1990, Manabe and Bryan used this coupled atmosphere-ocean model to simulate global warming over realistic continental geography, including the effects of the full ocean circulation. This led to a slew of insights, including the observation that land generally warms more than ocean, by a factor of about 1.5.
As with Arctic amplification, this land-ocean contrast can be seen in observed warming. It can also be explained from basic scientific principles and is roughly analogous to the way a dry surface, such as pavement, warms more than a moist surface, such as soil, on a hot, sunny day.
The contrast has consequences for land-dwellers like ourselves, as every degree of global warming will be amplified over land.
Forecast No. 5: Delayed Southern Ocean warming
Perhaps the biggest surprise from Manabe’s models came from a region most of us rarely think about: the Southern Ocean.
This vast, remote body of water encircles Antarctica and has strong eastward winds whipping across it unimpeded, due to the absence of land masses in the southern midlatitudes. These winds continually draw up deep ocean waters to the surface.
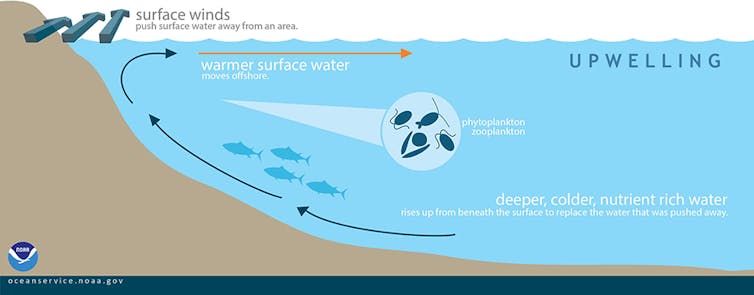
Manabe and colleagues found that the Southern Ocean warmed very slowly when atmospheric carbon dioxide concentrations increased because the surface waters were continually being replenished by these upwelling abyssal waters, which hadn’t yet warmed.
This delayed Southern Ocean warming is also visible in the temperature observations.
What does all this add up to?
Looking back on Manabe’s work more than half a century later, it’s clear that even early climate models captured the broad strokes of global warming.
Manabe’s models simulated these patterns decades before they were observed: Arctic Amplification was simulated in 1975 but only observed with confidence in 2009, while stratospheric cooling was simulated in 1967 but definitively observed only recently.
Climate models have their limitations, of course. For instance, they cannot predict regional climate change as well as people would like. But the fact that climate science, like any field, has significant unknowns should not blind us to what we do know.
Nadir Jeevanjee works for NOAA's Geophysical Fluid Dynamics Laboratory, which is discussed in this article. The views expressed herein are in no sense official positions of the Geophysical Fluid Dynamics Laboratory, the National Oceanic and Atmospheric Administration, or the Department of Commerce.
Read These Next
Held captive in their own country during World War II, Japanese Americans used nature to cope with t
Incarcerated in rough barracks surrounded by barbed wire and armed soldiers, Japanese Americans made…
Valentine’s Day cards too sugary sweet for you? Return to the 19th-century custom of the spicy ‘vine
Victorians found a way to anonymously tell people they didn’t like exactly how they felt.
Philadelphia was once a sweet spot for chocolatiers and other candymakers who made iconic treats for
Goldenberg’s Peanut Chews, Goobers and Whitman’s Sampler boxes of chocolates are just a few confectionary…


