Arctic sea ice hits its minimum extent for the year – 2 NASA scientists explain what's driving the o
A closer look at how ice cover changed through the months offers some important insights into the role of climate change and why every year isn’t a record.

September marks the end of the summer sea ice melt season and the Arctic sea ice minimum, when sea ice over the Northern Hemisphere ocean reaches its lowest extent of the year.
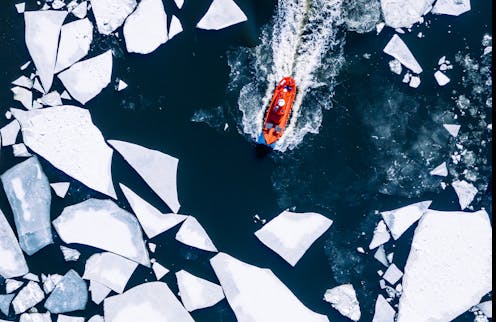
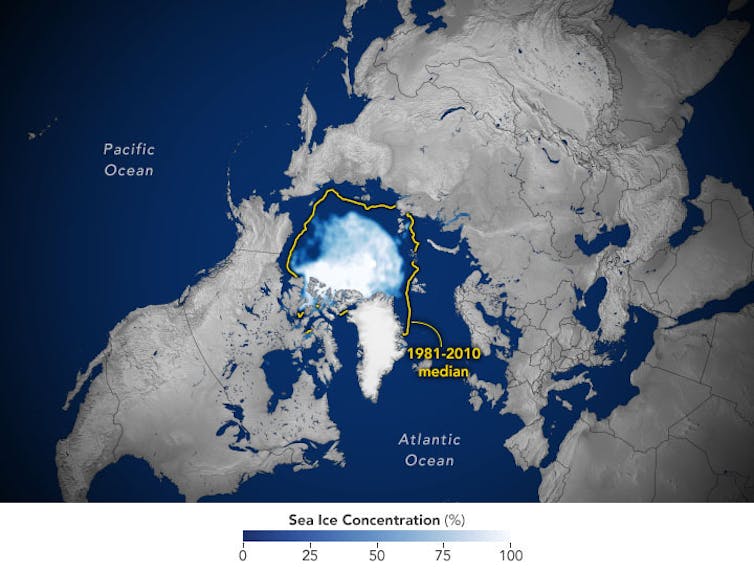
For ship captains hoping to navigate across the Arctic, this is typically their best chance to do it, especially in more recent years. Sea ice cover there has dropped by roughly half since the 1980s as a direct result of increased carbon dioxide from human activities.
As NASA scientists, we analyze the causes and consequences of sea ice change. In 2021, the Arctic’s sea ice cover reached its minimum extent on Sept. 16. While it wasn’t a record low, a look back through the melt season offers some insight into the relentless decline of Arctic sea ice in the face of climate change.
The Arctic is heating up
In recent years, Arctic sea ice levels have been at their lowest since at least 1850 for the annual mean and in at least 1,000 years for late summer, according to the latest climate assessment from the U.N.’s Intergovernmental Panel on Climate Change. The IPCC concluded that “the Arctic is likely to be practically sea ice free in September at least once before 2050.”
As the Arctic’s bright ice is replaced by a darker open ocean surface, less of the sun’s radiation is reflected back to space, driving additional heating and ice loss. This albedo feedback loop is just one of several reasons why the Arctic is warming about three times faster than the planet as a whole.
What happened to the sea ice in 2021?
The stage for this year’s sea ice minimum was set last winter. The Arctic experienced an anomalous high pressure system and strong clockwise winds, driving the thickest, oldest sea ice of the Central Arctic into the Beaufort Sea, north of Alaska. Sea ice scientists were taking note.
Summer melt began in earnest in May, a month that also featured multiple cyclones entering the Arctic. This increased sea ice drift but also kept temperatures relatively low, limiting the amount of melt.
The extent and pace of melting increased significantly in June, which featured a predominant low-pressure system and temperatures that were a few degrees higher than average.
By the beginning of July, conditions were tracking very close to the record low set in 2012, but the rate of decline slowed considerably during the second half of the month. Cyclones entering the Arctic from Siberia generated counterclockwise winds and ice drifts. This counterclockwise ice circulation pattern generally reduces the amount of sea ice moving out of the Arctic through the Fram Strait, east of Greenland. This likely contributed to the record low summer sea ice conditions observed in the Greenland Sea.
This ice circulation pattern also increased ice export out of the Laptev Sea, off Siberia, helping create a new record low for early summer ice area in that region. The low pressure system also increased cloudiness over the Arctic. Clouds generally block incoming solar radiation, reducing sea ice melt, but they can also trap heat lost from the surface, so their impact on sea ice melt can be a mixed bag.
In August, sea ice decline slowed considerably, with warm conditions prevailing along the Siberian coast, but cooler temperatures north of Alaska. The Northern Sea Route – which Russia has been promoting as a global shipping route as the planet warms – was actually blocked with ice for the first time since 2008, although ice breaker-supported transits were still very much possible.
At this stage of the melt season, the sea ice pack is at its weakest and is highly responsive to the weather conditions of a given day or week. Subtle shifts can have big impacts. Freak end-of-summer weather events have been linked to the record low sea ice years of 2007 and 2012. “The Great Arctic Cyclone of 2012” is an interesting example.
There’s ongoing debate over the effect they have. However, scientists are broadly in agreement that specific storms may not have actually played that big a role in driving the record lows in those years – things are never that straightforward when it comes to weather and sea ice.

The Arctic sea ice reached its 2021 minimum extent on Sept. 16, coming in at 4.72 million square miles (1.82 million square kilometers), the 12th lowest on record.
So, the 2021 melt season was, despite all the stops and starts, pretty typical for our new Arctic, with the September minimum ending up slightly higher than what we would have expected from the long-term downward trend. But various new record lows were set in other months and regions of the Arctic.
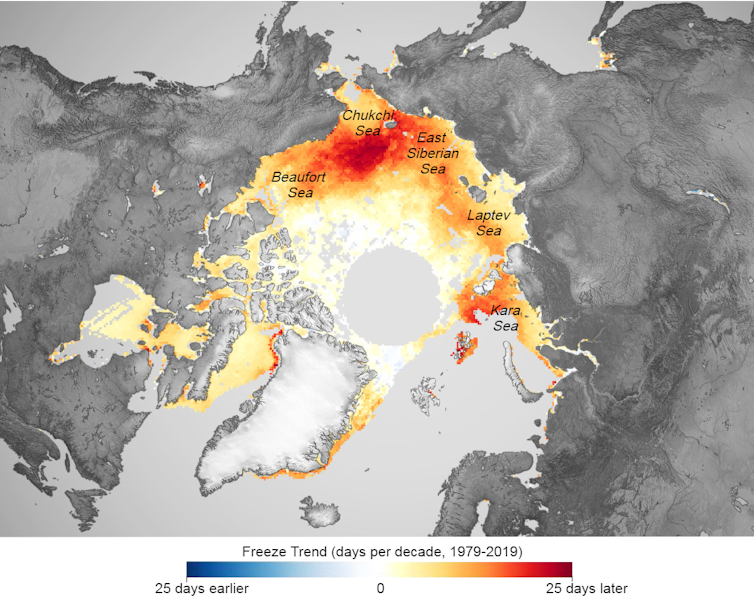
As the hours of sunlight dwindle over the coming weeks and temperatures drop, Arctic sea ice will start to refreeze. The ice pack will thicken and expand as the surrounding ocean surface temperatures drop toward the freezing point, releasing a lot of the heat that had been absorbed and stored through summer.

This refreeze has started later in recent years, shifting into October and even November. The more heat the ocean gains during summer, the more heat needs to be lost before ice can begin to form again. Because of this, some of the biggest warming signals are actually observed in fall, despite all the attention given to summer ice losses.
There’s still a lot we don’t know
For people living and working in the high Arctic, understanding local ice conditions on a given day or week is what really matters. And predicting Arctic sea ice at these more local scales is even more challenging.
As 2021 demonstrated, sea ice is highly dynamic – it moves and melts in response to the weather patterns of the day. Think how hard it is for forecasters to predict the weather where you live, with good understanding of weather systems and many observations available, compared to the Arctic, where few direct observations exist.
Weather events can also trigger local feedback loops. A freak heat wave, for example, can trigger ice melt and further warming. Winds and ocean currents also break up and spread ice out across the ocean, where it can be more prone to melt.
Sea ice scientists are hard at work trying to understand these various processes and improve our predictive models. A key missing part of the puzzle for understanding sea ice loss is ice thickness.
Thickness times area equals volume. Like area, sea ice thickness is thought to have halved since the 1980s, meaning today’s Arctic ice pack is only about a quarter of the volume it was just a few decades ago. For those hoping to navigate the Arctic Ocean, knowing the thickness of any ice they may encounter is crucial. Sea ice thickness is much harder to measure consistently from space. However, new technologies, like ICESat-2, are providing key breakthroughs.
Despite all this uncertainty, it’s looking pretty likely that summer ice-free Arctic conditions are not too far away. The good news is that the path forward is still largely dependent on future emissions, and there is still no evidence the planet has passed a tipping point of sea ice loss, meaning humans are still very much in the driver’s seat.
Alek Petty receives funding from NASA.
Linette Boisvert receives funding from NASA.
Read These Next
Colorectal cancer is increasing among young people, James Van Der Beek’s death reminds – cancer exp
Colon cancer symptoms can be subtle. While lifestyle changes can help reduce your risk, open communication…
Counter-drone technologies are evolving – but there’s no surefire way to defend against drone attack
Companies are selling a range of anti-drone devices, from guns that fire nets to powerful laser weapons,…
Trump says climate change doesn’t endanger public health – evidence shows it does, from extreme heat
Climate change is making people sicker and more vulnerable to disease. Erasing the federal endangerment…


