1 in 6 US kids are in families below the poverty line
An alternative approach to measuring poverty detected a decline in 2021, amid a surge in government support for low-income families.


In the United States, children are more likely to experience poverty than people over 18.
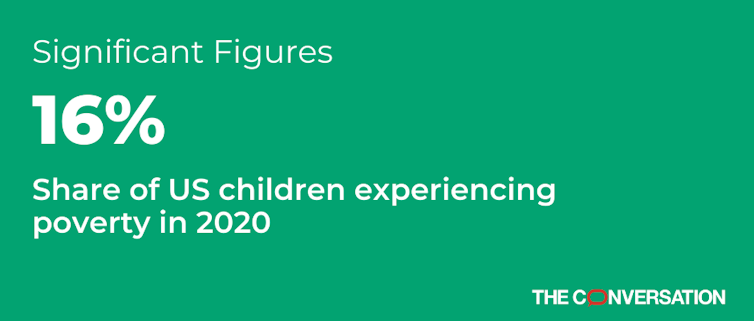
In 2020, about 1 in 6 kids, 16% of all children, were living in families with incomes below the official poverty line – an income threshold the government set that year at about US$26,500 for a family of four. Only 10% of Americans ages 18 to 64 and 9% of those 65 and up were experiencing poverty, according to the most recent data available.
The official child poverty rate ticks down when the economy grows and up during downturns. It stood at 17% in 1967 – just about the same as in 2020. In many recent years the rate hovered even higher – around 20%.
Another way to measure poverty
Researchers calculate the official poverty rate by adding up a household’s income and comparing it with a threshold of what is needed to survive.
The government has calculated this rate the same way since the 1960s.
One of its shortcomings is that it excludes several sources of income, including tax credits and the Supplemental Nutrition Assistance Program, which are intended to reduce poverty.
In 2011, the government began to calculate an alternative metric: the supplemental poverty measure. It includes SNAP and tax credits. It also uses thresholds based on the cost of living in different areas of the country. For a family of four, this threshold currently ranges from $24,000 to $35,000, depending on where a family lives and whether they own or rent housing.
According to this alternative measure, 10% of children were living in poverty in 2020, the lowest rate ever recorded.
Depending on which measure you use, either 7 million or 11.7 million U.S. children lived in poverty in 2020.
By both metrics, poverty is higher for children of color. The official poverty rate for Black children stood at 26%, and 23% for Hispanic children, while for white, non-Hispanic children it was 10%.
Before and after 2020
Both child poverty rates had been declining before the COVID-19 pandemic.
The official rate dipped to 14% in 2019 from 21% five years earlier. It shot back up to 16% in 2020, when the pandemic compounded economic hardships for many families.
The supplemental measure of child poverty tells a more complete story.
Steps the government took during the pandemic, including its series of economic impact payments, the child tax credit expansion and a boost in SNAP benefits, led the supplemental child poverty rate to keep declining even during the economic crisis.
The government will release its child poverty data for 2022 in September 2023. But some researchers at Columbia University have monthly data suggesting that child poverty rose steeply after the expiration of the pandemic-era programs. They estimate that 3.7 million more children were living in poverty in January 2022 than in December 2021 because of the expiration of the child tax credit expansion.
Callie Freitag receives funding from the Center for Financial Security at the University of Wisconsin-Madison.
Heather D. Hill currently has research funding from the Perigee Fund and the Center for Financial Security at the University of Wisconsin, Madison.
Read These Next
What triumphalist narratives about Brazil’s high court and Bolsonaro imprisonment leave out
However, there is a more profound lesson we can learn from Brazil: Democracy depends on more than institutions.
Are there thunderstorms on Mars? A planetary scientist explains the red planet’s dry, dusty storms
A rover recently captured sounds of lightning crackling on Mars, over a decade after scientists uncovered…
American farmers, who once fed the world, face a volatile global market with diminishing federal bac
The US government used to have American farmers’ backs, but that support has been dwindling for decades.…


